Data Analytics Course Curriculum: What You’ll Actually Learn
Data Analytics Course Curriculum: What You’ll Actually Learn
Thinking about becoming a data analyst but wondering what you would actually learn in a data analytics course?
You are not alone.
For beginners, the world of data analytics can feel like a pile of unfamiliar words: Excel, SQL, Power BI, Tableau, DAX, data modelling, dashboards, databases, AI and more.
The good news is that you do not need to master everything at once.
A structured data analytics course should take you from the fundamentals of working with data to analysing real business problems, communicating insights and building projects that demonstrate what you can do.
That is the approach behind the 10Alytics Data Analytics Program.
The programme is designed to take learners from foundational concepts through tools such as Excel, Power BI, SQL and Tableau, while also incorporating Microsoft Fabric, AI-assisted analytics, portfolio projects and career preparation.
So, what do you actually learn?
Let's break it down.
What Do You Learn in a Data Analytics Course?
A practical data analytics curriculum typically covers five major areas:
- Data analytics fundamentals and Excel
- Business intelligence and Power BI
- SQL and relational databases
- Tableau, Microsoft Fabric and AI-assisted analytics
- Portfolio development and career preparation
Each stage builds on the previous one.
You are not simply learning software. You are learning how to use data to understand problems, find patterns, communicate insights and support better business decisions.
What Does a Data Analyst Actually Do?
Phase 1: Data Analytics Foundations and Advanced Excel
Before working with databases and business intelligence platforms, you need to understand how analysts approach problems.
That starts with the foundations.
Introduction to Data Analytics
You begin by understanding what data analytics actually involves.
This includes learning how organisations collect and use data, how analysts approach business problems and how raw information can be transformed into useful insights.
You also begin developing the analytical mindset required to move beyond simply reporting numbers.
A good analyst does not just ask:
"What happened?"
They also learn to ask:
- Why did it happen?
- What changed?
- What patterns can we identify?
- What should the business investigate next?
- What action could the data support?
Excel for Data Analytics
Excel remains an important tool for data analysis, particularly when working with spreadsheets, operational reports and smaller datasets.
In this stage, you move beyond basic formulas and learn how Excel can be used for practical analysis.
You will work with skills such as:
- Data cleaning
- Logical functions
- Lookup functions
- XLOOKUP
- INDEX/MATCH
- Data organisation
- Pivot Tables
- Data summaries
- Analytical reporting
For example, XLOOKUP can be used to search a range and return a corresponding value from another range, making it useful when combining information across datasets. Microsoft's documentation provides further technical guidance on the function.
Excel Dashboarding
Numbers become much more useful when people can understand them quickly.
You will therefore learn how to turn Excel data into dashboards and visual reports using tools such as:
- Pivot Tables
- Charts
- Slicers
- Dynamic reporting
- Dashboard layouts
The objective is not simply to make a dashboard look attractive.
It is to make the information easier for a decision-maker to understand.
Phase 2: Business Intelligence and Power BI
Once you have developed your Excel foundation, the curriculum moves into Business Intelligence (BI).
This is where you begin working with larger datasets and interactive reporting environments.
Power BI and Data Modelling
Microsoft Power BI is widely used for connecting data sources, transforming data, building models and creating interactive reports.
In this stage, you learn how to:
- Connect to different data sources
- Import and transform data
- Clean datasets using Power Query
- Create relationships between tables
- Understand data modelling
- Build analytical models
- Create interactive dashboards
Power Query is Microsoft's data preparation and transformation engine and can be used for extract, transform and load (ETL) processes.
DAX and Power BI Dashboards
Next comes DAX — Data Analysis Expressions.
DAX allows analysts to create calculations and measures within Power BI data models.
You may use DAX to calculate metrics such as:
- Revenue growth
- Year-over-year performance
- Profit margins
- Customer retention
- Churn
- Average order value
- Performance against targets
Microsoft describes DAX as a collection of functions, operators and constants used to create formulas and expressions for analytical models.
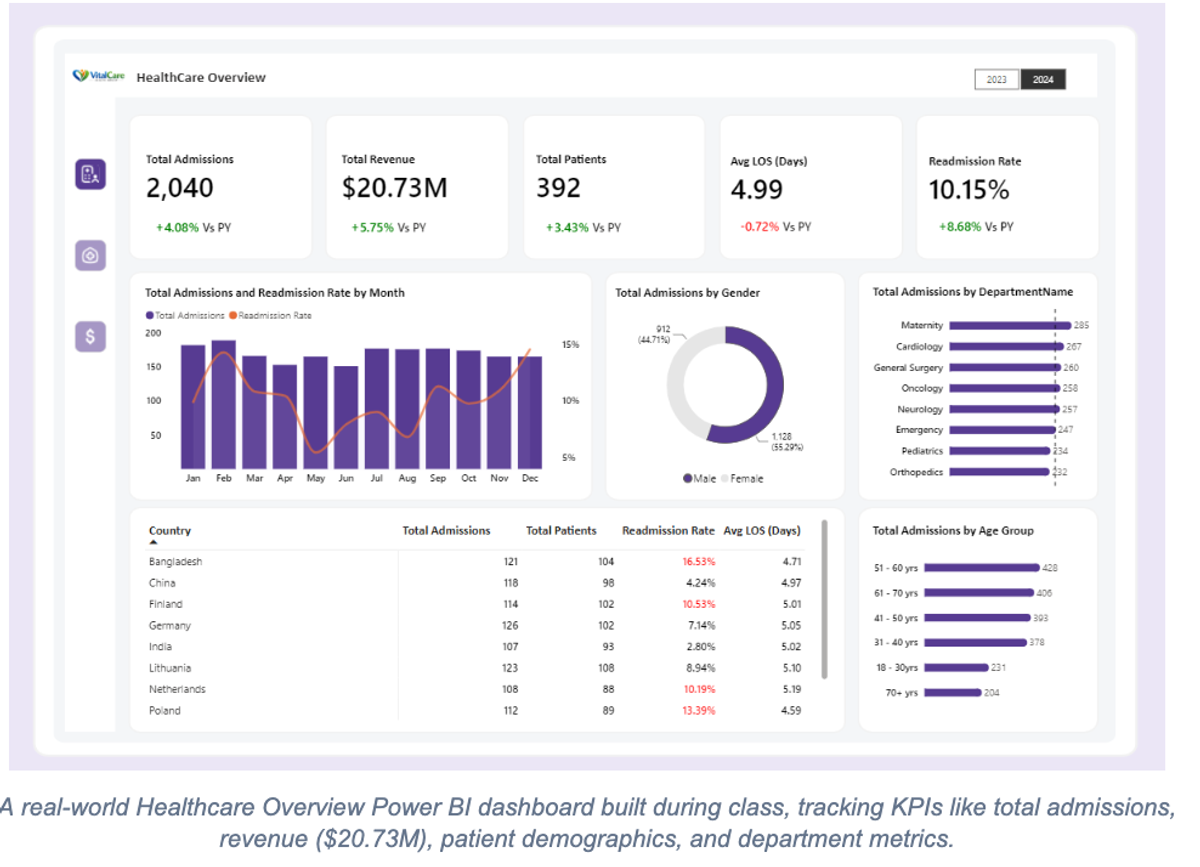
But learning DAX is only part of the process.
You also learn how to present the results through dashboards that make complex information easier for stakeholders to interpret.
Power BI Service
Data analysis does not stop when you create a dashboard on your laptop.
In real organisations, reports often need to be published, shared, refreshed and managed.
The curriculum therefore introduces you to the Power BI Service and concepts such as:
- Publishing reports
- Cloud-based workspaces
- Automated data refresh
- Sharing reports
- Stakeholder access
- Permissions
This helps you understand the difference between creating a dashboard for yourself and creating reporting that can actually be used by a team.
Phase 3: SQL and Relational Databases
Excel and Power BI are powerful, but much of the data used by organisations lives inside databases.
That is where SQL comes in.
SQL, or Structured Query Language, is one of the most important technical skills for aspiring data analysts.
Understanding Relational Databases
Before writing complex queries, you need to understand how databases are structured.
You will learn concepts including:
- Tables
- Rows and columns
- Primary keys
- Foreign keys
- Relationships
- Relational databases
- Database interfaces
This gives you the foundation required to understand how information is stored and connected.
SQL for Data Analytics
You then learn how to use SQL to retrieve and analyse data.
This includes:
- SELECT statements
- Filtering
- Sorting
- Aggregations
- GROUP BY
- JOINs
- Business metrics
- Data analysis queries
For example, instead of manually searching thousands of customer records, you can write a query that identifies customers who meet a particular set of conditions.
That is the difference between simply looking at data and being able to interrogate it.
Advanced SQL Functions
As your skills develop, you move into more complex analytical scenarios.
You will work with concepts such as:
- Subqueries
- CASE statements
- String functions
- Date functions
- Window functions
- Complex joins
- Analytical calculations
These skills become particularly useful when working with large datasets and answering real business questions.
How to Prepare for Your First Data Analyst Interview
SQL is also one of the skills you should expect to encounter when preparing for data analyst interviews, alongside portfolio projects, your CV and your ability to explain your analytical thinking.
Phase 4: Tableau, Microsoft Fabric and AI for Data Analytics
Learning the core analytics tools is important.
But modern data teams are also working with increasingly connected platforms and AI-assisted workflows.
This is why the curriculum goes beyond Excel, Power BI and SQL.
Tableau for Data Visualisation
Tableau is another major data visualisation and business intelligence platform.
You will learn how to use Tableau to:
- Explore trends
- Analyse time-series data
- Create dashboards
- Identify patterns
- Communicate insights
- Build visual stories for stakeholders
The goal is not to collect as many tools as possible.
It is to understand how different analytics platforms can help you answer different business questions and communicate findings effectively.
Microsoft Fabric
The programme also introduces Microsoft Fabric, Microsoft's unified analytics platform.
Fabric brings together capabilities including data engineering, data science, data warehousing, real-time intelligence and Power BI within a broader analytics environment.
[EXTERNAL LINK: What is Microsoft Fabric? → Link to Microsoft Learn]
For an aspiring analyst, exposure to platforms such as Fabric can help you understand how individual analytics tasks fit into larger organisational data workflows.
Using AI and ChatGPT for Data Analytics
AI is also changing how analysts work.
Rather than treating AI as a replacement for analytical thinking, you can use it as an assistant for tasks such as:
- Explaining SQL queries
- Drafting SQL
- Debugging formulas
- Exploring DAX calculations
- Generating sample datasets
- Brainstorming analytical approaches
- Summarising findings
- Documenting analytical work
The important skill is knowing what to ask AI, how to validate its output and when not to trust an answer without checking it.
That means AI becomes part of your workflow rather than a substitute for understanding the fundamentals.
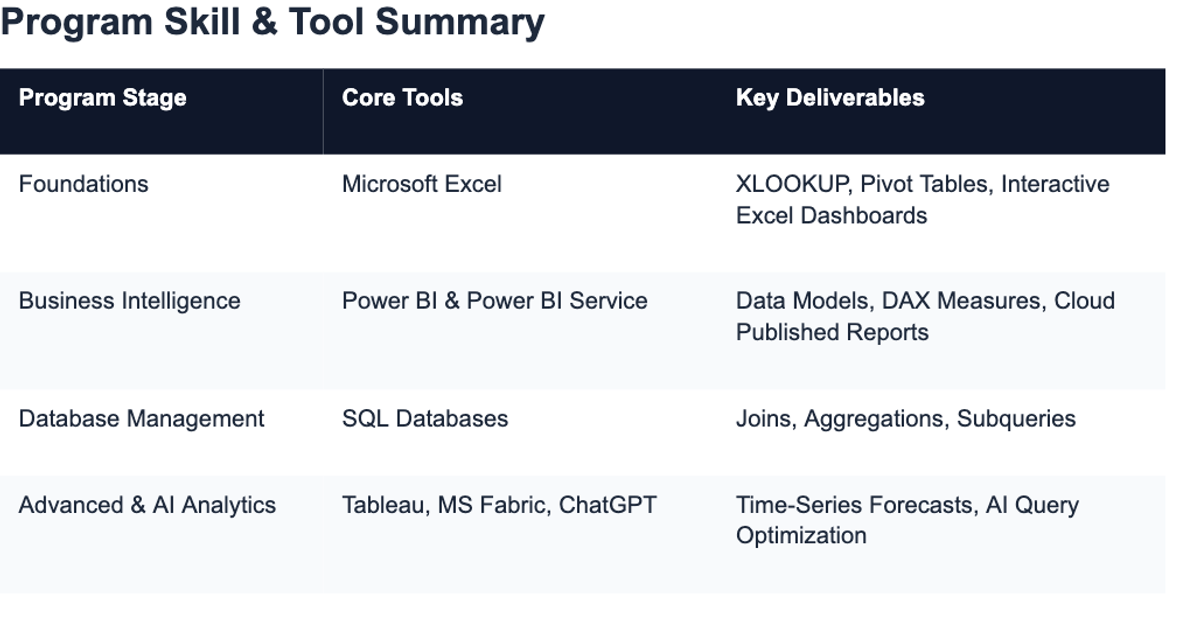
Data Analytics Course Curriculum: Tools and Skills at a Glance
Stage
Tools
Skills You Develop
Foundations
Microsoft Excel
Data cleaning, formulas, XLOOKUP, Pivot Tables, dashboards
Business Intelligence
Power BI
Data modelling, Power Query, DAX, interactive dashboards
Database Analytics
SQL
Queries, joins, aggregations, subqueries, window functions
Data Visualisation
Tableau
Dashboards, trends, time-series analysis, visual storytelling
Modern Analytics
Microsoft Fabric
Unified analytics workflows and data platforms
AI-Assisted Analytics
ChatGPT and AI tools
Query assistance, analysis support, debugging and workflow acceleration
Career Preparation
Portfolio and career tools
Projects, CV development, LinkedIn positioning and interview preparation
Phase 5: Real-World Projects and Portfolio Development
Here is something many beginners discover too late:
Knowing the tools is not the same as demonstrating that you can use them.
You can complete 50 Excel tutorials and still struggle to answer the question:
"Show me what you have actually analysed."
That is why practical projects matter.
Within the 10Alytics learning journey, learners work on realistic business scenarios and projects designed to help them apply their skills.
These can include datasets and scenarios across areas such as:
- Healthcare
- E-commerce
- Finance
- Logistics
- Operations
- Customer behaviour
The objective is to move from:
"I know Power BI."
to:
"I used Power BI to analyse this business problem and produced these insights."
That distinction matters when building a data analytics portfolio.
What Should a Data Analytics Portfolio Include?
A strong beginner portfolio can demonstrate your ability to:
- Understand a business problem
- Find and clean relevant data
- Analyse the data
- Identify meaningful patterns
- Build visualisations
- Explain your findings
- Make evidence-based recommendations
Your projects can then become talking points during interviews.
What Employers Actually Want From Junior Tech Talent
Phase 6: CV, LinkedIn and Data Analyst Interview Preparation
Learning data analytics is only one part of transitioning into the field.
You also need to know how to communicate your skills to employers.
Career preparation can include:
CV and Resume Development
Instead of simply listing:
"Excel, SQL, Power BI, Tableau"
your CV should demonstrate how you used those tools to solve problems.
For example:
Weak:
"Created Power BI dashboards."
Stronger:
"Built an interactive Power BI dashboard to analyse sales performance, customer trends and regional revenue."
The second statement gives a recruiter more context about what you actually did.
LinkedIn and Portfolio Positioning
Your LinkedIn profile should make it easy for someone to understand:
- What you do
- What tools you use
- What problems you can solve
- What projects you have completed
- What type of role you are targeting
Your portfolio should then provide evidence.
Data Analyst Interview Preparation
Finally, you need to prepare for the hiring process itself.
This can include:
- SQL questions
- Excel assessments
- Power BI tasks
- Data interpretation questions
- Case studies
- Behavioural interview questions
- Portfolio discussions
How to Prepare for Your First Data Analyst Interview
The goal is to be able to explain not only what you built, but why you built it, what you discovered and what you would recommend based on the data.
What Can You Do After Learning Data Analytics?
A data analytics skill set can be applied across many industries.
Depending on your previous experience and career goals, you may explore roles such as:
- Data Analyst
- Business Intelligence Analyst
- Reporting Analyst
- Marketing Analyst
- Operations Analyst
- Financial Analyst
- Healthcare Data Analyst
- Product Analyst
- Junior Analytics Consultant
Your previous professional experience can also influence the direction you take.
For example, someone coming from healthcare may explore healthcare analytics, while someone with a finance background may apply analytics skills to financial reporting or business intelligence.
If you are still deciding which technology career path fits your background, you can also explore the 10Alytics career quiz .
Do You Need a Technical Background to Learn Data Analytics?
Not necessarily.
Data analytics requires technical skills, but it also requires problem-solving, communication, curiosity and the ability to understand business questions.
That is one reason data analytics can be attractive to people transitioning from different professional backgrounds.
Teachers, healthcare professionals, finance professionals, marketers, administrators and operations professionals, for example, may already have experience working with information, solving problems and communicating findings.
The technical skills can then be developed through structured learning and practice.
How Teachers Can Transition into Data Analytics
The important thing is not where you are starting.
It is whether you are willing to build the skills and practise applying them.
Is a Data Analytics Course Worth It?
There is no single answer for everyone.
You can learn data analytics independently through books, tutorials, documentation, projects and online resources.
A structured programme can be useful if you want a defined curriculum, instructor support, practical projects, accountability and career guidance in one learning environment.
The important question is not simply:
"Should I take a data analytics course?"
A better question is:
"What learning structure will help me consistently build the skills and evidence I need?"
If you choose a programme, look beyond the number of tools listed on the curriculum.
Check whether you will actually practise those tools, complete projects, receive feedback and learn how to communicate your work.
Start Building Your Data Analytics Skills
Becoming a data analyst is not about memorising every function in Excel, writing the most complicated SQL query or creating the flashiest dashboard.
It is about learning how to take a business question, work with data, find useful information and communicate what that information means.
That is why a strong data analytics course curriculum should combine technical skills with practical application.
The 10Alytics Data Analytics Program takes learners through Excel, Power BI, SQL, Tableau, Microsoft Fabric and AI-assisted analytics, alongside practical projects and career preparation.
Ready to explore the curriculum?
Explore the 10Alytics Data Analytics Program → https://www.10alytics.io/instructor-led-courses/data-analytics
Not sure whether Data Analytics is the right career path for you?
Take the 10Alytics Career Quiz
Want to learn with other aspiring tech professionals, access career resources and stay connected to the 10Alytics ecosystem?
And if you want to start exploring AI alongside your existing career or analytics skills, check out the 10Alytics AI Automation Course, a practical self-paced course built around real-world automation projects.
Explore the AI Automation Course
Frequently Asked Questions About Data Analytics Courses
What do you learn in a data analytics course?
A data analytics course typically covers data analysis fundamentals, Excel, SQL, data visualisation, business intelligence, data modelling, dashboards, portfolio projects and career preparation. The specific tools and depth depend on the programme.
Is data analytics difficult for beginners?
There is a learning curve, particularly when you start working with SQL, data modelling and analytical concepts. However, beginners can build these skills progressively by learning the fundamentals and applying them through practical projects.
What tools should a beginner data analyst learn?
Common tools include Microsoft Excel, SQL, Power BI and Tableau. Depending on the programme and career path, learners may also encounter Microsoft Fabric, Python and AI tools.
Do I need coding experience to become a data analyst?
You do not necessarily need previous programming experience to begin learning data analytics. Many beginner programmes start with tools such as Excel and gradually introduce SQL and other technical concepts.
How long does it take to learn data analytics?
The timeline varies depending on your starting point, learning schedule and the depth of skills you want to develop. A structured programme can provide a defined learning path, while self-paced learning can take longer or shorter depending on your consistency.
Can data analytics skills help me transition into tech?
Data analytics is one possible pathway into technology because organisations across industries use data to make decisions. Your existing professional experience can also influence which analytics roles and industries you pursue.
What should I include in a data analyst portfolio?
A data analyst portfolio should demonstrate how you approach problems and use data. Projects can include the original business question, data cleaning, analysis, dashboards or visualisations, key insights and recommendations.
Finally, I believe…
You do not become job-ready in data analytics simply by watching tutorials.
You become more prepared by learning the fundamentals, practising the tools, solving realistic problems, building projects and learning how to communicate your findings.
That is the journey a structured data analytics programme should help you take.
Start with the fundamentals. Build the skills. Practise with real data. Build your portfolio. Then keep improving.